Logstash and Kibana3 via Docker
Logstash is an amazing log management application. Backed by ElasticSearch, it collects, parses, and indexes logs. Kibana is an alternative UI for searching and analyzing the log data in elasticsearch sent via logstash. Version 3 of Kibana is beautiful and revamped to require little configuration if using ElasticSearch. Here is a quick way to build out a distributed logging platform using Docker.
At Arcus, we are all in with Docker and have several repositories for various applications and services. We will use a few of them in this example. We have Github repositories with all of the source for the Docker repos as well; links below.
ElasticSearch
We will first start an ElasticSearch container for the data storage. The Arcus Logstash image allows using an embedded ElasticSearch but we will use a separate one.
Launch an ElasticSearch container:
docker run -d arcus/elasticsearch
Get the port (and host if running a remote docker instance) for the ElasticSearch container:
docker ps
Will show something like:
4d19e28a2774 arcus/elasticsearch:latest /opt/elasticsearch/b 3 seconds ago Up 2 seconds 49157->9300, 49158->9200
Logstash
We will now setup logstash. The Arcus repo contains a default configuration but you can specify your own if desired. The default will setup Logstash to accept syslog as an input and output to ElasticSearch.
Launch a Logstash container using the ElasticSearch host/port as environment variables:
docker run -d -e ES_HOST=<DOCKER_HOST_IP> -e ES_PORT=<DOCKER_CONTAINER_PORT> arcus/logstash
Replace <DOCKER_HOST_IP> with the IP of your docker host (i.e. your public facing IP, perferably not 127.0.0.1) and <DOCKER_CONTAINER_PORT> with the port that was allocated for port 9300.
Kibana
Now for Kibana. We will be using the milestone 2 release.
Launch a Kibana container using the ElasticSearch host/port as environment variables:
docker run -d -e ES_HOST=<DOCKER_HOST_IP> -e ES_PORT=<DOCKER_CONTAINER_PORT> arcus/kibana
Replace <DOCKER_HOST_IP> with the IP of your docker host (i.e. your public facing IP, perferably not 127.0.0.1) and <DOCKER_CONTAINER_PORT> with the port that was allocated for port 9200.
Get the port allocated for Kibana on port 80:
docker ps
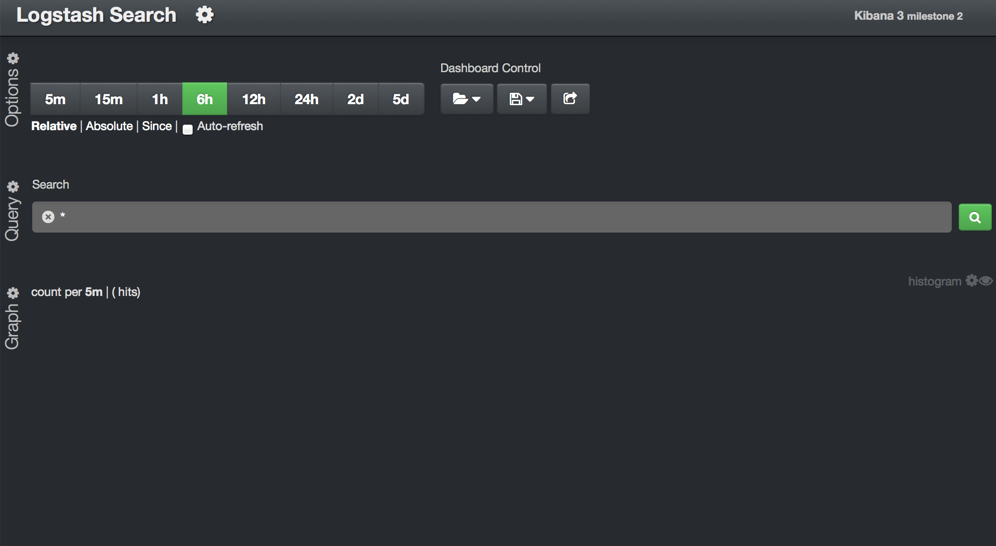
Open a browser to http://<DOCKER_HOST_IP>:<KIBANA_DOCKER_PORT>
You should see this:
Syslog
We will now launch a container to send some data.
docker run -i -t base /bin/bash
In the container run the following:
echo "*.* @@<DOCKER_HOST_IP>:<LOGSTASH_CONTAINER_PORT>" >> /etc/rsyslog.d/50-default.conf
Replace <DOCKER_HOST_IP> with the IP of your docker host (i.e. your public facing IP, perferably not 127.0.0.1) and <LOGSTASH_CONTAINER_PORT> with the port that was allocated for port 514.
Now still in the container run the following to start rsyslog:
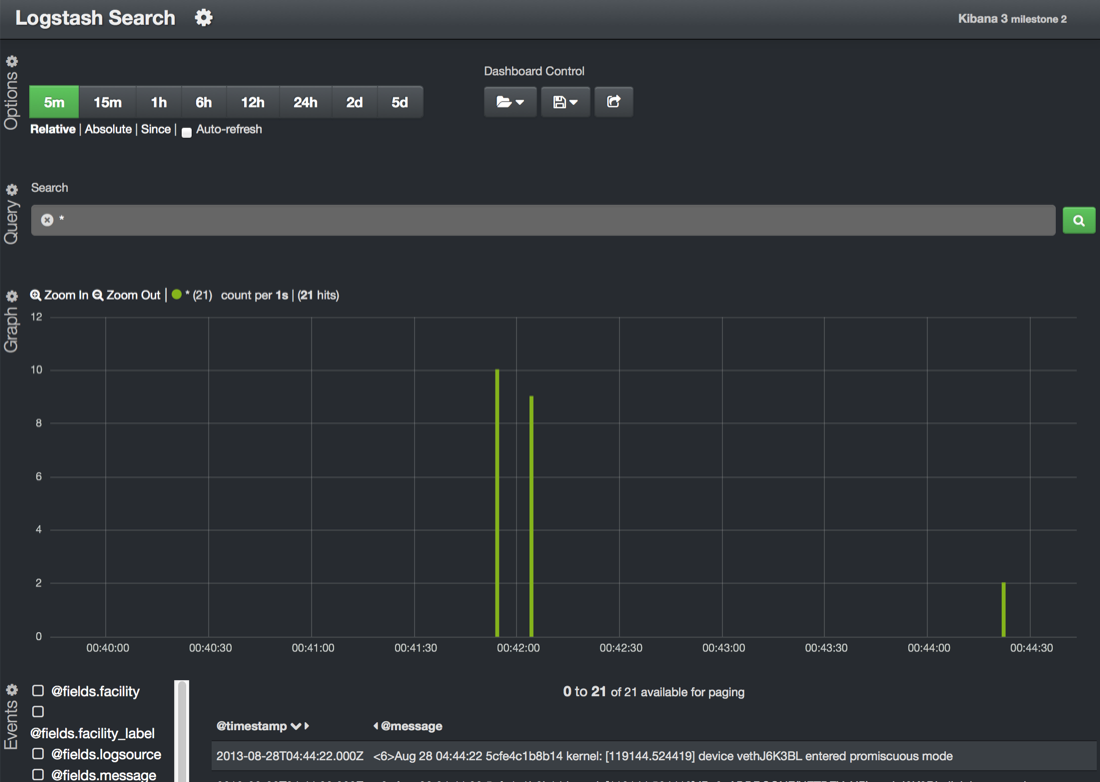
rsyslogd -c5
You should see it logging now:
With just a short while playing with the new Kibana and the editor, there is almost a limitless possibility of graphs, etc. for logging. Hopefully this is a quick way to test/deploy it yourself.
Docker Repositories
blog comments powered by Disqus